Many firms combine methods. We fuse them, cross-checking every finding across all three lenses.
It answers What is actually true, and how confident can we be?
How the fusion worksExperience & Service Design
Retention, cost to serve and half the roadmap rest on one picture of the journey, and that picture is often a map drawn in a workshop plus a satisfaction score. We follow the journey where it happens, read what customers say when no survey is asking, and measure which friction is actually costing you money.
What’s at stake
Depth is what keeps it standing.
Our lens
Ask someone how a service went and they won’t narrate the twenty steps they went through. What stays in their memory is the sharpest moment and the last one, which is why a dashboard with every touchpoint in green can seem useless when customers stop coming back. Measuring a journey step by step tells you how each part performed, but not which parts people took home. That is what our H3™ method is built for: three lenses on the same journey, fused into one reading you can act on.
Many firms combine methods. We fuse them, cross-checking every finding across all three lenses.
It answers What is actually true, and how confident can we be?
How the fusion worksWhat we do
Each one answers a different question, from the first minute on a screen to the call three months later that decides whether a customer stays.
Experience & Service Design | 01 of 05
Research that follows your customers through the journey they actually live, across every channel, so you fix the friction that costs you most, first.
A journey map shows the steps a company controls. The journey people live has other edges: the wait nobody mapped, the third time they had to explain their case.
We follow the journey where it happens, size what each friction costs, and hand you the order to fix them in.
Say a private health insurer maps the journey from choosing a specialist to the refund landing, and finds three frictions, with budget to fix one of them this year. Everything you’d normally have to go on is already on the map.
Three frictions, one budget
What you can seeComplaints, calls and reviews are often the only signal a company has, so the deepest drop gets the money. It’s also the friction people take the most trouble to report.
What that hidesFew people complain about an ending. They finish the journey, form a view, and take it with them to the renewal date and to the next person who asks them for a recommendation.
Pick the one you’d fix.
Illustration of ours, built on a pattern we keep meeting: the volume of complaints a moment generates and the revenue it costs are two different quantities, and many companies only measure the first. In a real project the frictions, the reach and the recovery all come from your own base, in your own markets.
Tick the ones that sound familiar.
Two or more sound familiar? That’s usually where our first conversation starts. Tell us the decision you’re facing
Experience & Service Design | 02 of 05
Research into how people really use your app, website or tool, so you know where they struggle, even when they get there in the end.
People are stubborn: they finish what they set out to do, so the completion rate stays high while the effort behind it goes unrecorded.
We run the sessions in the local language, with your real audience, and keep going until the routes stop telling us anything new.
Say a rail operator tests one task in its app: buy a ticket for tomorrow morning. The task has five steps, and the dashed line is the route the product expects. Every participant you add finishes the task, and what changes is how far they go off the route, and in which direction.
The route you designed
What you’re looking atFive steps in the order the product expects them. This is the flow that gets walked through internally and signed off, and on this line every user behaves the same way.
What it leaves outTwelve people ran this task and all twelve finished it. Nothing in that sentence tells you what finishing cost them, or whether the cost was the same every time.
Add the first participant.
Illustration of ours, built on a pattern that holds across sessions: the first few participants generate most of the findings, and after a point new people trace routes you’ve already seen. Where that point falls depends on the task and the audience, which is why we watch for it instead of fixing the sample in advance. The direction of each detour is taken from the session recording, not inferred from analytics.
Tick the ones that sound familiar.
Two or more sound familiar? That’s usually where our first conversation starts. Tell us the decision you’re facing
Experience & Service Design | 03 of 05
Research for services that keep failing in the same places, so you fix the cause instead of redecorating the symptom.
When the visible part of a service fails, the instinct is to redesign what customers touch. The decision that caused it was usually taken somewhere else.
We map the service front and back, and trace each failure to the decision that caused it.
Say an appliance retailer sells a fridge with delivery and installation. On the left are the five moments the customer lives through, and on the right is what the organisation does to make each one happen, and who owns it. People complain at three of the five moments, and none of them is where the problem was created.
A blueprint, not a screen
What the map showsThe left column is everything the customer experiences, and the right column is what the organisation does so that it can happen. The dashed line between them marks what the customer can and can’t see.
What that meansEach of the three red moments can only be fixed by a team that will never meet the person complaining, at a point in the service that has already passed by the time it hurts.
Tap any of the three red moments.
Illustration of ours. In a real project the two columns are built from fieldwork on both sides of the line: sessions with customers, and time spent with the people who run the service. The right-hand column is usually the one nobody has written down, and it’s where most of the answers turn out to be.
Tick the ones that sound familiar.
Two or more sound familiar? That’s usually where our first conversation starts. Tell us the decision you’re facing
Experience & Service Design | 04 of 05
Co-creation sessions with your team and your customers, built on fieldwork, so the ideas in the room start from real people.
Ask people what to build and you get a solution shaped by whatever they used last week. Ask about the moment that made them ask, and you get something to design against.
We bring the evidence into the room, run the session on top of it, and leave with decisions the team can defend on Monday.
Say an energy company comes out of a research round with three customer requests, and each one can be read in two defensible ways. Both readings usually have a defender in the meeting, and only one of them survives the fieldwork.
"We want an app that shows our consumption in real time."
Repeated in nine of fourteen sessionsWhich reading would you build from?
Two ways to read the same sentence
Why this is hard to agree onBoth readings are defensible and each has somebody in the meeting who believes it, but only one is what people actually meant.
What a workshop can’t settleEveryone is reading the same sentence with a different set of assumptions, and the loudest set often wins. Nothing said around that table can rule any of them out.
In a room, this tends to get settled by whoever argues hardest.
Illustration of ours. The two readings aren’t invented for the exercise: in a real project they come out of the sessions themselves, and what settles them is collected before anybody is asked to choose.
Tick the ones that sound familiar.
Two or more sound familiar? That’s usually where our first conversation starts. Tell us the decision you’re facing
Experience & Service Design | 05 of 05
Voice of the customer run as research, with the people your feedback channels never reach, so you hear from the customers who never fill in a survey.
Every feedback channel is answered by whoever felt like answering. The customers who matter most to next year’s revenue often have the least reason to tell you anything.
We run voice of the customer as research: we read what arrives knowing who sent it, and we go and recruit the people your channels were never going to reach.
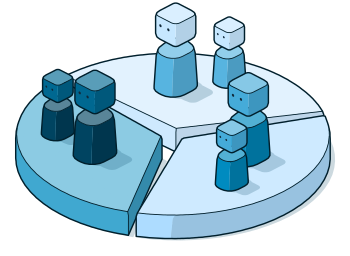
Say a mobile operator has one hundred customers, grouped here by how they behave rather than by who they are. Fifteen of them won’t renew. Every button below is a real feedback channel, and not one of them reaches the whole hundred.
One hundred customers, four ways of behaving
What you’re looking atEvery one of the hundred has a view about you. The four groups differ in what they think and, for a feedback programme, in something that matters far more: whether they ever tell you.
Why this decides your numbersA feedback channel measures whoever chose to speak there, not your customer base, and each of the four channels collects a different crowd.
Pick a channel and see who actually speaks there.
Illustration of ours, built on a shape we keep finding: risk tends to be understated in self-selected channels, because going silent is often what leaving looks like before it happens. In a real project the groups, the overlaps and the size of the gap all come from your own base, and the people missing from it are recruited on purpose.
Tick the ones that sound familiar.
Two or more sound familiar? That’s usually where our first conversation starts. Tell us the decision you’re facing
How the work runs
A recommendation is only as trustworthy as the work behind it. These are the foundations ours runs on, each with its own page.
Who runs your project
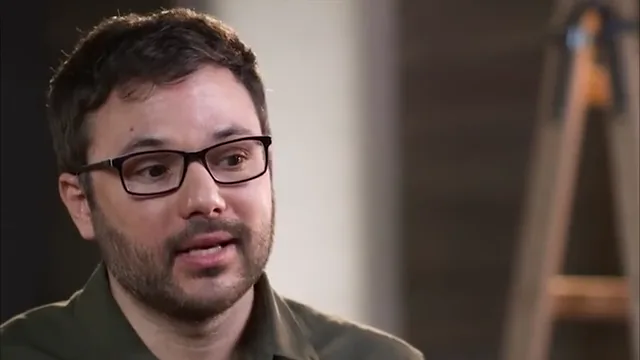
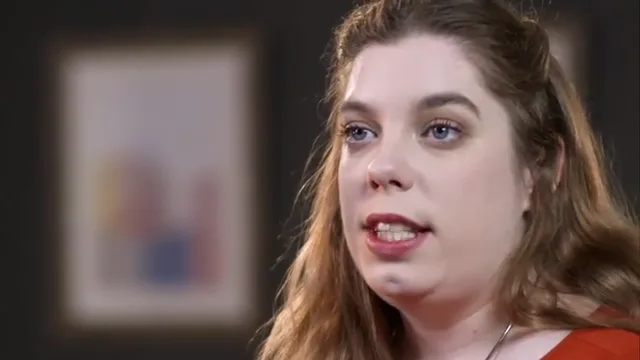
Boutique has a practical meaning here: Abdo López and Norah Walsh, both social anthropologists, work on every project, and nothing is handed to juniors once the contract is signed.
“The riskiest assumptions are the ones everyone in the room already agrees on. Our job is to find out whether they’re true before you bet on them.”
Where this connects
By the time a customer feels something, three decisions have already been taken elsewhere: who they are, what your brand promised, and how your people are measured.
On your business model
 Reputation, Organisation & ImpactEarn the trust, navigate the change, and see the human risks others miss.
Straight answers
Something else on your mind? Ask us directly. You’ll get an answer from the people who would run the work.
Two things at once, and they compound. A satisfaction score measures the people who answered it, and anybody still willing to spend three minutes on your survey is by definition still spending goodwill on you. The customers who have decided to leave usually go quiet before they go, so they’re missing from that number, from the review site and from the support line as well. On top of that, a score is an average of steps, and people rarely remember an experience as an average. They keep the worst moment and the last one, and those two are what they tell the next person deciding whether to sign. That combination is how a company ends up with a healthy dashboard and a renewal problem in the same quarter. We recruit the people your channels were never going to reach, follow the journey where it actually happens rather than where it’s documented, and size what each friction costs against your own customer base.
Every quote is built for the project, because the variables move a great deal. How many markets and languages, how many touchpoints are in scope, whether the work is a usability round on one flow or a journey study across the whole relationship, whether we need time behind the line with the people who deliver the service, how hard the audience is to reach, which is very different for a consumer app than for a hospital ward or a depot at six in the morning, and what you need in your hands at the end. A moderated usability round in one market and a service blueprint across four countries with back-stage fieldwork are different projects with very different numbers. Most of our projects sit in the six-figure range. We scope after a proper conversation about the decision you’re making, and you get a fixed price and a timeline before any work begins.
Often because they were drawn in a workshop by people who know the service from the inside, so they show the steps the company controls, in the order the company delivers them. That’s useful as a shared language, but it can’t settle an argument, because nothing on the map is measured. It can’t tell you how many people hit a given moment, what it costs when they do, or which of two fixes is worth more, so the meeting tends to go to whoever argued hardest. We take the map you already have and treat it as what it is, a hypothesis worth checking. Then we go and check it: fieldwork with customers where the journey happens, the conversation they have about it when nobody is asking, and numbers that size each friction against your own customer base. You get the same map back with evidence attached, plus the moments that were never on it because nobody inside the building could see them.
We research it, we design the recommendation with you, and we don’t take over the build. In practice you get a blueprint of the service as it actually runs, front stage and back stage, each visible failure traced to the decision that caused it and the team that owns it, the promises the front of the service makes that the back was never built to keep, and a prioritised set of changes with what each one is worth. Co-creation sessions with your people and with real customers are part of that, and so is being in the room when the hard trade-offs get made. Building the thing belongs with your teams or with the design and technology partners you already work with, and we stay close enough while they do it to keep the reasoning intact. We say this plainly because the same two words cover both jobs in this industry, and the difference matters a great deal when you’re deciding who to brief.
That question is the deliverable. Answering it properly needs four things behind it: how many customers pass through the moment, how much it weighs for them when they do, what it costs to change, and who has to agree before anything moves. The loudest friction is rarely at the top of that list, because complaining is what people do while they’re still deciding to stay. The moments that end a relationship often generate almost no complaints at all, which is why they survive budget rounds year after year. We size each one against your own customer base, in money rather than in adjectives, and we say which one to start with and why that one. You’re free to disagree with the order, and you’ll be able to see exactly what it rests on.
Fewer than most people expect, and the honest answer is that it isn’t a number anyone should pick in advance, because it’s a point you reach and recognise. Sessions stop earning their cost when new participants trace routes you have already seen and the count of distinct problems stops moving, which on a well defined task tends to happen somewhere between the sixth and the tenth person, per market and per audience. Booking twenty in advance buys a longer report rather than a better decision, and booking five and stopping there is how a real problem gets missed. So we run the sessions in waves, watch for the point where the map stops changing, and tell you when it arrives. Sometimes that means recruiting more than we planned, and sometimes it means finishing early and saying so, which we’d rather do than fill the remaining slots.
Both, and the connection between them is what the firm is built on. We call it insight-led strategic intelligence because research earns its cost when it makes the strategy sound. In this category that means you get the evidence and what to do with it: which friction to fix first and what it is worth in renewals, what to leave alone because it is already doing the work, the decisions upstream that keep producing the same failure and the team that owns each of them, the promises to stop making until the service can keep them, and the places where the interface really is the problem rather than the symptom of one. The point is that your company loses less time and money going in the wrong direction.
Abdo López and Norah Walsh lead every project in person, from the framing session to the final reading, and everyone working alongside them is senior with more than a decade in the field. Around that core we build the team for the project. The right moderator for a usability session in Japanese is not the right one for a day in a depot with a delivery crew, and the specialist who reads a service operation from the inside is not the one who runs the quantitative sizing, so we select the experts, the partners and the technology that fit the question, the technique, the country and the industry. There’s no handover to a junior once the contract is signed, and that’s the main reason we stay small.
Tell us the decision you’re carrying: three frictions and budget for one, or a redesign that didn’t move the complaints. You get a fixed price and a timeline before anything starts.